


Interested in our services
Contact our experts to provide further information


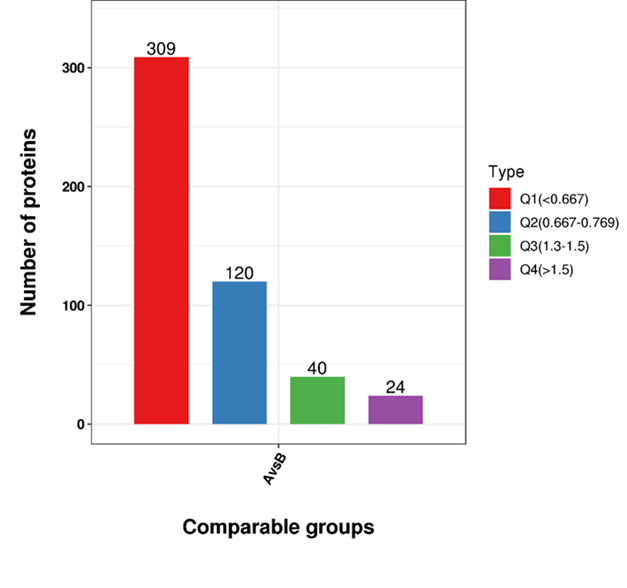
After the differentially expressed protein-based enrichment analysis of GO, KEGG pathway and protein domain, the quantified proteins in this study were divided into four quantitative categories according to the quantification ratio, called Q1 to Q4, shown in the figure. Then, we performed enrichment analysis of GO, KEGG pathway and protein domain in each Q group, and performed cluster analysis to find the correlation of the protein function of different differential expression multiples in the comparison groups.
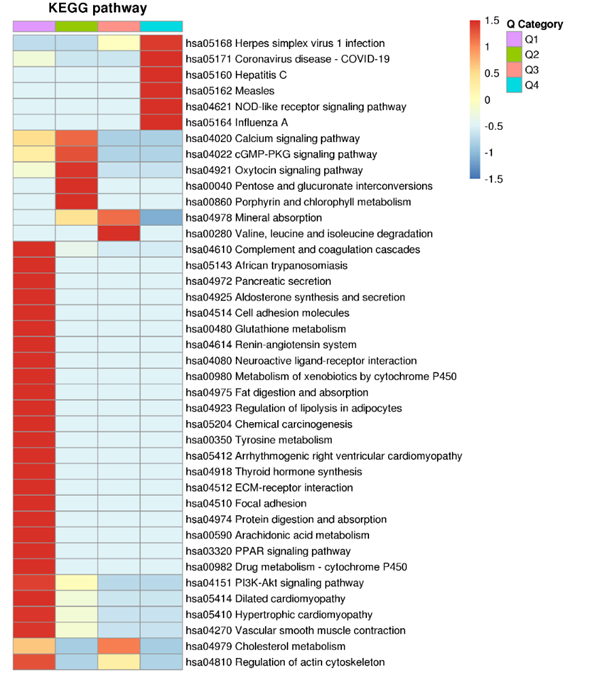
According to the Fisher’s exact test P value obtained by the enrichment analysis, the related functions in different Q groups was gathered with the hierarchical clustering method and draw a heatmap. The horizontal axis of the heatmap is the different Q groups, and the vertical axis is the description of the related functions (GO, KEGG pathway, Protein domain) enriched by the differentially expressed proteins in the different comparison groups. The color blocks corresponding to the functional description of the enrichment of differentially expressed proteins in different Q groups indicate the significance of enrichment. Red represents strong enrichment and blue represents weak enrichment.
Interested in our services
Contact our experts to provide further information