


Interested in our services
Contact our experts to provide further information


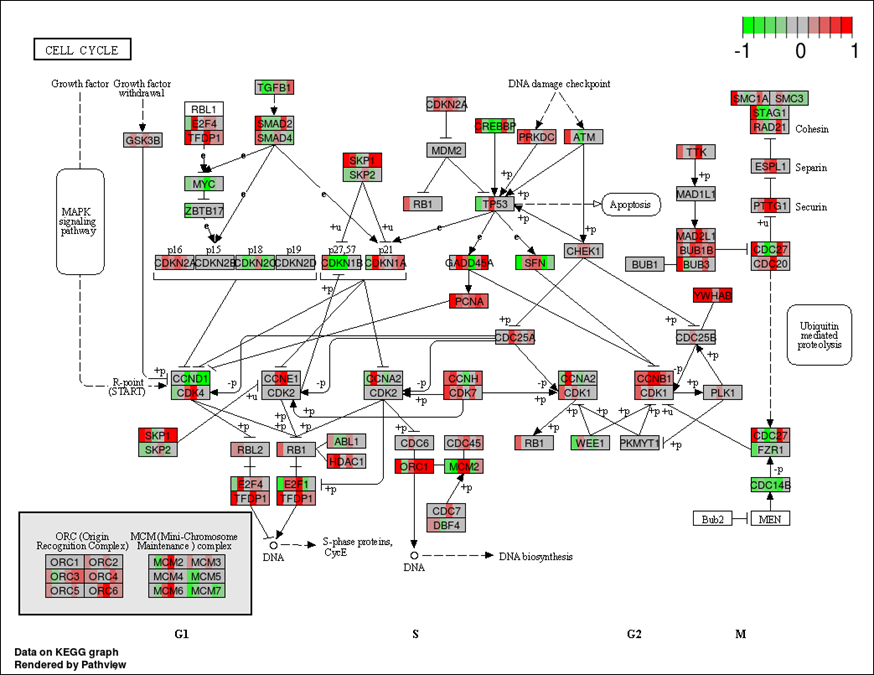
The KEGG pathway obtained from the enrichment analysis was visualized in the form of a web page. Then, map and render users' data on relevant pathway graphs. In the figure, red indicates up-regulated protein; green indicates down-regulated protein.
Pathview Web: user friendly pathway visualization and data integration-2017-Nucleic acids research
Pathview: an R/Bioconductor package for pathway-based data integration and visualization-2013-Bioinformatics
Interested in our services
Contact our experts to provide further information