


Interested in our services
Contact our experts to provide further information


This analysis focused on the correlation analysis of the respective expression differences between the proteome and the transcriptome.
Differential analysis was performed on the proteome and transcriptome respectively. The significantly differentially expressed transcripts and proteins were screened out, and the overlap between the significantly differentially expressed transcripts and proteins was analyzed. Then, according to the differential expression of genes at different levels (transcription level, protein level), the genes were classified. The GO and KEGG pathway enrichment and cluster analysis were performed on the gene sets under different classifications.
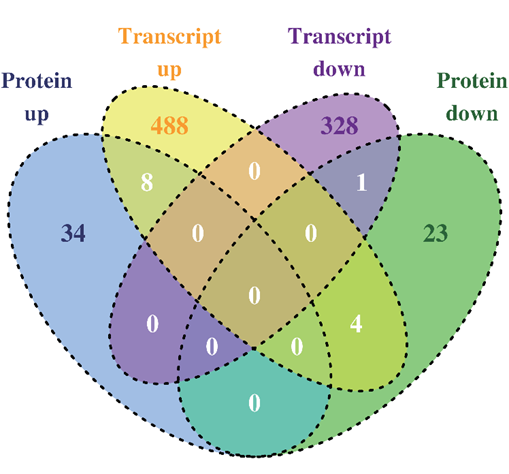
Venn diagram for comparative analysis of differentially expressed proteins and transcripts.
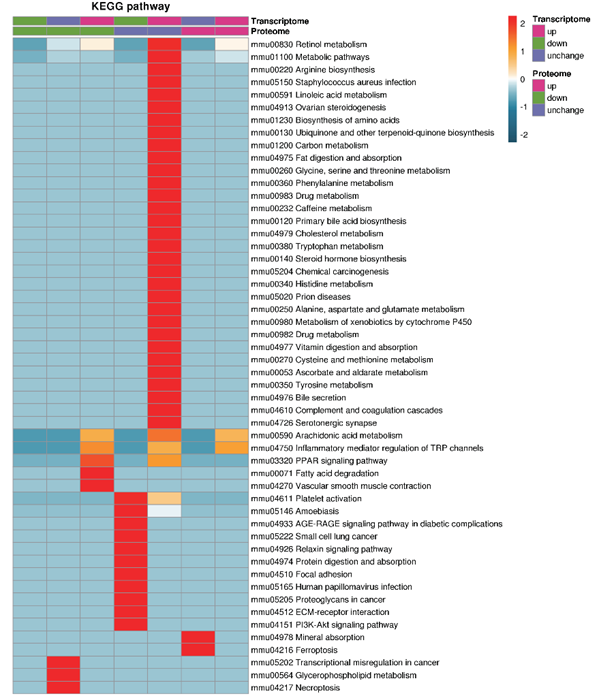
Cluster heatmap based on KEGG pathway enrichment of genes under different regulatory relationships. The horizontal direction represents the classification of different regulatory relationships, and the vertical direction is the significantly enriched KEGG pathway. The color blocks corresponding to gene sets and functional descriptions under different regulatory relationships indicate the degree of enrichment.
Interested in our services
Contact our experts to provide further information